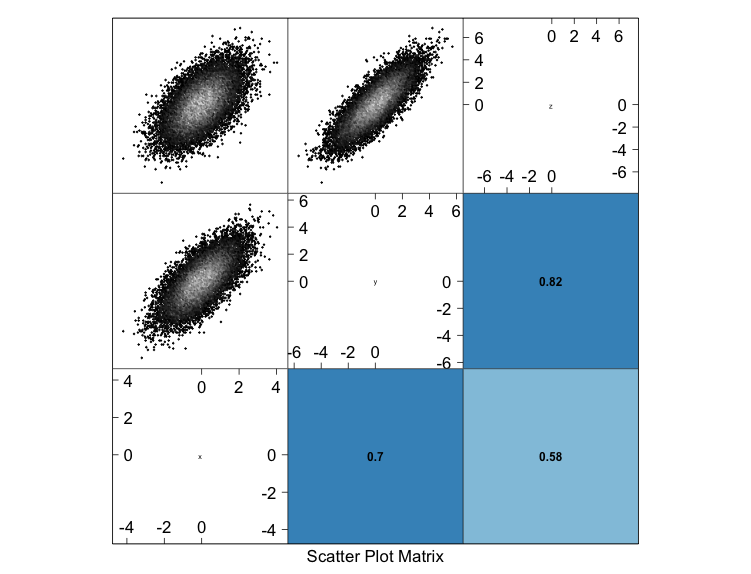
Modify splom to use hexbin panels and show pearson correlations
November 30, 2012The following function will display a scatter plot matrix based on
splom (a lattice function) with the following modifications:
- the scatter plots are replaced with hexbin plots
- the lower diagonal shows pearson correlation coefficients instead of scatter plots
library(lattice)
library(latticeExtra)
library(hexbin)

compRepl <- function(df) {
# function to compare replicates (each variable of df)
# as hexbin plot matrix
# Args:
#   df      data frame
# Results:
#   lattice plot
  ct <- custom.theme(
            symbol = c("black", brewer.pal(n = 8, name = "Dark2")),
            fill = brewer.pal(n = 12, name = "Set3"),
            region = brewer.pal(n = 11, name = "Spectral"),
            reference = "#e8e8e8",
            bg = "transparent", fg = "black",
            lwd=2, pch=16
  )
  ct$axis.text$cex = 1.4
  ct$par.xlab.text$cex = 1.4
  ct$par.ylab.text$cex = 1.4

  splom(~df,
        #pscales = 0, #don't show axes,
        par.settings = ct,
        upper.panel = panel.hexbinplot,  # use hexbinplot
        xbins = 100,                     # number of bins
        trans = log10, inv=function(x) 10^x, # density color scale transformation
        #colramp = magent,                   # with this color scheme
        colramp = LinGray,
                                        # show correlation coefficient in lower panel
        lower.panel = function(x,  y, ...) {
          panel.fill(col = brewer.pal(9, "RdBu")[round(cor(x, y) *  4 + 5)])
          panel.text(sum(range(x))/2, sum(range(y))/2, round(cor(x, y), 2), font = 2)
        },
        varname.cex = 0.6 #smaller name in diagonal
  )
}
Example usage:
x <- rnorm(20000)
y <- x + rnorm(20000, 0.05)
z <- y + rnorm(20000, 0.05)
compRepl(data.frame(x, y, z))