Smoothing data with Savitzky-Golay filters
June 26, 2014Savitzky-Golay filters can be used to smooth data by fitting a low degree polynomial to the values in a sliding window using least squares. For equally spaced data points a set of coefficients can be calculated that can be applied to a subset of the data in a sliding window to estimate the smoothed signal at the center of the window and obtain results equivalent to fitting each window. These filters are good at preserving line shape while removing higher frequency noise. For more details see the Wikipedia entry.
In addition to creating smoothed data, smoothed versions of the mth derivative of the data can also be generated by Savitzky-Golay filters.
The sgolay function in the signal
package
calculates these coefficients for us and the
filter (from signal, not base R) can be used to apply these coefficients
to data. Rather than returning a single set of coefficients that
estimates the signal at the center of the sliding window based
on values before and after the center of the window, sgolay also
returns coefficients that only use values after the point to be
estimated, coefficients that only use values preceeding the point
to be estimated, and everything in between. That way, the filter can
be used to estimate smoothed signal at all points of the signal, including
the end points where there are no preceeding/following data points.
Some example data:
set.seed(99)
n <- 100
x <- (1:n) / n
clean.data <- ((exp(1.2*x)+1.5*sin(7*x))-1)/3

df <- data.frame(
    x = x,
    clean = clean.data,
    noisy = clean.data + rnorm(n, 0, 0.12)
)
The filter coefficients (1nd order polynomials, 0th derivative, length 11):
library(signal)
sg <- sgolay(p=1, n=13, m=0)
dim(sg)
## [1] 13 13
Applied to the data
df$sg <- filter(sg, df$noisy)
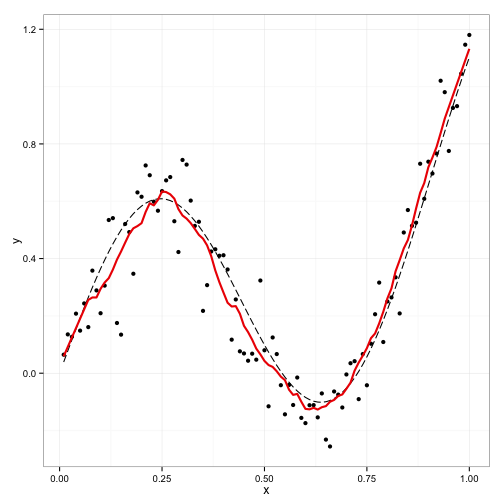
Plotting the results
library(ggplot2)
p <- ggplot(df) +
    geom_point(aes(x, noisy), size = 2) +
    geom_line(aes(x, clean), linetype = "longdash") +
    geom_line(aes(x, sg), col = "red2", size = 1) +
    ylab("y") +
    theme_bw()
print(p)
sessionInfo()
## R version 3.1.0 (2014-04-10)
## Platform: x86_64-apple-darwin10.8.0 (64-bit)
##
## locale:
## [1] en_US.UTF-8/en_US.UTF-8/en_US.UTF-8/C/en_US.UTF-8/en_US.UTF-8
##
## attached base packages:
## [1] stats     graphics  grDevices utils     datasets  methods   base
##
## other attached packages:
## [1] knitr_1.6     ggplot2_1.0.0 signal_0.7-4
##
## loaded via a namespace (and not attached):
##  [1] colorspace_1.2-4 digest_0.6.4     evaluate_0.5.5   formatR_0.10
##  [5] grid_3.1.0       gtable_0.1.2     labeling_0.2     MASS_7.3-31
##  [9] munsell_0.4.2    plyr_1.8.1       proto_0.3-10     Rcpp_0.11.2
## [13] reshape2_1.4     scales_0.2.4     stringr_0.6.2    tools_3.1.0