Create smoothscatter like plots with ggplot2
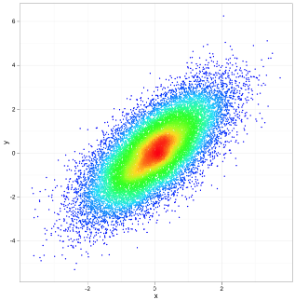
November 6, 2012In scatter plots with large amounts of data which results in lots of
overplotting, it can be useful to indicate density of data points.
Smoothscatter does this with a color palette. However, smoothscatter
uses R base graphics. With ggplot2, a similar effect can be achieved
using the densCols function and scale_color_identity:
x <- rnorm(20000)
y <- x + rnorm(20000, 0.05)
df <- data.frame(x = x, y = y,
  d = densCols(x, y, colramp = colorRampPalette(rev(rainbow(10, end = 4/6)))))
p <- ggplot(df) +
    geom_point(aes(x, y, col = d), size = 1) +
    scale_color_identity() +
    theme_bw()
print(p)
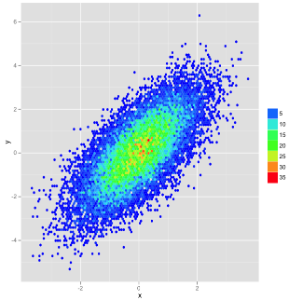
Alternatively, one can introduce transparency, which can (for low
densities) be helpful for overplotting. Or use geom_hexbin:
p <- ggplot(df) + geom_hex(aes(x, y), bins = 100) +
         scale_fill_gradientn("", colours = rev(rainbow(10, end = 4/6)))
print(p)